Andra Arnold & Associates are a Top Rated, Award-Winning Guelph real estate team that has a passion for helping people. We truly live by our motto “Here to Help”. Our team brings quality expertise to our clients’ buying and selling experiences. The team's dedication, eagerness to help, and experience allow clients navigate one of life’s biggest decisions!
Guelph Real Estate Market – June 2019
Guelph Real Estate Market Update June 2019
Overall Market Data
Average Days on Market in 2018: #24
Average Days on Market in 2019: #25
The average amount of days for homes to be on the Guelph real estate market has increased by 1 day.
Average Sale Price in 2018: $512,360
Average Sale Price in 2019: $546,921
From 2017 to 2018, the average sale price of Guelph homes has increased by 6%.
Units Sold in 2018: #208
Units Sold in 2019: #214
There has been a 2% increase in homes sold in the Guelph real estate market over the month of June.
Neighbourhood Data
Average Days on Market
Average Days on Market in 2018: #22
Average Days on Market in 2019: #20
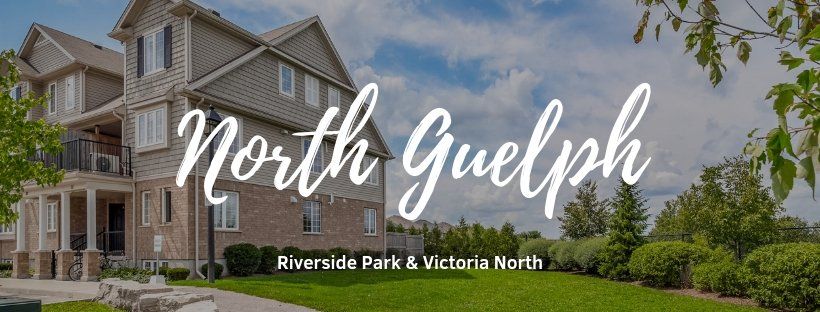
In the North End, homes have been on the Guelph real estate market for 2 days less on average.
Average Sale Price
Average Sale Price in 2018: $456,747
Average Sale Price in 2019: $527,921
There has been an increase in the average sale price of homes in the North End of Guelph by 15 % .
Units Sold
Units Sold in 2018: #18
Units Sold in 2019: #30
There have been 67 % more units sold between June 2018 and June 2019.
Average Days on Market
Average Days on Market in 2018: #29
Average Days on Market in 2019: #25
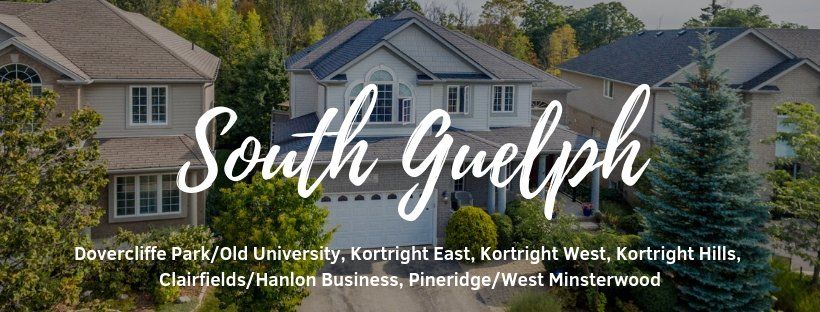
For the South End of Guelph, homes have been on the Guelph real estate market for 4 day less on average.
Average Sale Price
Average Sale Price in 2018: $585,500
Average Sale Price in 2019: $573,508
There has been a decrease in the average sale price of homes in the South End of Guelph by -2% .
Units Sold
Units Sold in 2018: #86
Units Sold in 2019: #72
There have been 16 % fewer units sold in the South End from 2018 to 2019.
Average Days on Market
Average Days on Market in 2018: #19
Average Days on Market in 2019: #22
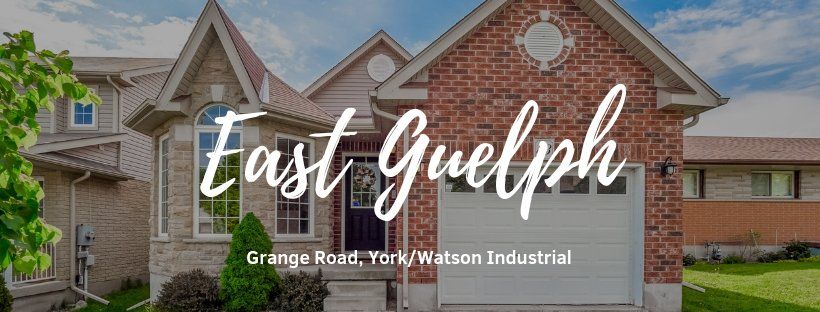
For the East End of Guelph, homes have been on the Guelph real estate market for 3 days more on average.
Average Sale Price
Average Sale Price in 2018: $508,756
Average Sale Price in 2019: $508,883
There has been an increase in the average sale price of homes in the East End of Guelph by 0.02 % .
Units Sold
Units Sold in 2018: #27
Units Sold in 2019: #29
There have been 7% more units sold in the East End of Guelph from 2018 to 2019.
Average Days on Market
Average Days on Market in 2018: #17
Average Days on Market in 2019: #25
For the West End of Guelph, homes have been on the Guelph real estate market for 8 days more on average.
Average Sale Price
Average Sale Price in 2018: $413,362
Average Sale Price in 2019: $510,347
There has been an increase in the average sale price of homes in the West End of Guelph by 23 % .
Units Sold
Units Sold in 2018: #40
Units Sold in 2019: #34
There have been -15% fewer units sold in the West End from June 2018 to 2019.
Average Days on Market
Average Days on Market in 2018: #22
Average Days on Market in 2019: #29
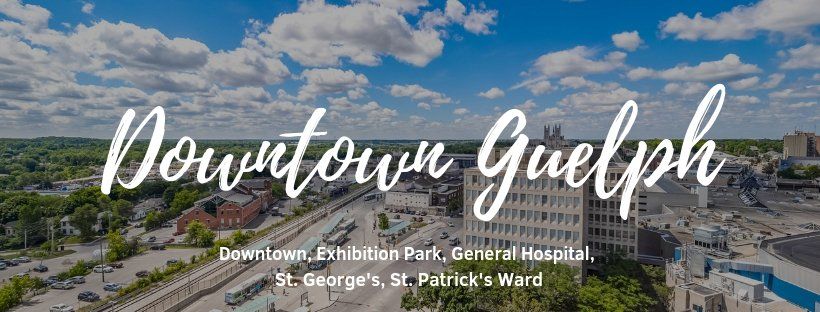
For Downtown Guelph, homes have been on the Guelph real estate market for 7 days more on average.
Average Sale Price
Average Sale Price in 2018: $468,546
Average Sale Price in 2019: $567,494
There has been an increase in the average sale price of homes in the Downtown Guelph by +21% .
Units Sold
Units Sold in 2018: #34
Units Sold in 2019: #47
There have been 38 % more units sold in Downtown Guelph from 2018 to 2019.
Average Days on Market
Average Days on Market in 2018: #41
Average Days on Market in 2019: #53
Puslinch homes have been on the market for 12 days more on average.
Average Sale Price
Average Sale Price in 2018: $896,857
Average Sale Price in 2019: $989,929
There has been an increase in the average sale price of homes in Puslinch by +10 % .
Units Sold
Units Sold in 2018: #7
Units Sold in 2019: #7
There has been no change in units sold in Puslinch from 2018 to 2019.


